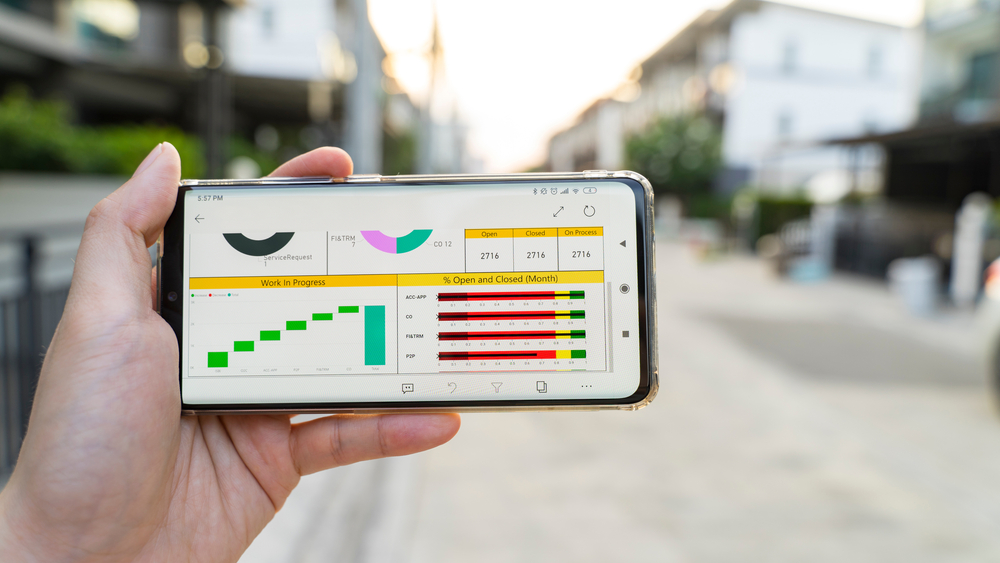
How do Dataframe use Tableau?
DateFrame can help you utilise your organisations data in the most effective way.
These dashboards make it easier for non-technical analysts and end users to convert data into understandable, interactive graphics which makes it a lot easier for you to use and utilise your data in the best way possible!
Tableau facilitates the use of data from public sources in conjunction with your proprietary data, enabling new and useful insight to improve your data and business practices. Tableau saves time when updating daily and weekly reports that currently reside in spreadsheets. That’s because Tableau separates the data layer from the presentation layer and makes updating a spreadsheet data source a trivial append to the bottom of your source spreadsheet.
Tableau is a way to expand the frequency, depth and variety of data used in your organisation. Most importantly, Tableau’s visual analytical capabilities are easy to use and present large and granular data sets more effectively than legacy reporting tools and spreadsheet reports.


What Tableau is not
Tableau is not a data creation tool.
You can make new data in Tableau using forecasts, trend lines, reference lines, calculated values and table calculations.
However, if data creation or modeling of novel scenarios is your primary need (building a budget for example), use a spreadsheet.
Tableau is not an ETL engine for cleaning-up bad data, although it can be very helpful in identifying missing or erroneous data in your existing data sources. Visualising data via time series, bar charts, scatter plots or in maps highlights errors and outliers more effectively than grids of data in a spreadsheet.

